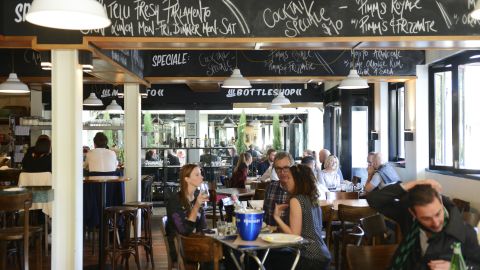
For the first time, the City has produced in-depth data about local customers in our neighbourhoods from morning to night.
From independent to high street fashion, casual eateries to sophisticated dining, each of our precincts has a unique offering and distinct local character.
To understand customer needs and experiences in each area, we carried out 6,000 surveys with international guests, domestic visitors and Sydney residents.
The research details customer demographics, including why they visited, what they did in the area and how they rated the experience. It also tells us how visitors got there and how they spent their money.
Unsurprising for Sydney foodies, the research found that eating out and drinking coffee were the most common activities across all our neighbourhoods. This goes for visitors of different ages and social backgrounds, no matter where they have travelled from.
But what you may not know, is 3 out of 4 people go online to find out what to do.
“For the first time, we have a detailed understanding of consumer behaviour in our villages over an 18 hour period,” City Business Manager, Lara Wolski said.
“This information will really help businesses make informed decisions on staffing, pricing and ways in which they can diversify their business to better suit their customers.”
See data profiles for CBD North and CBD Centre, Chinatown and CBD South, Potts Point, Oxford Street, Newtown, Pyrmont, Glebe, Redfern, Surry Hills and Green Square, or download the full report.
Published 31 May 2018, updated 14 February 2024


